I built this Ubuntu-based test server as a multi-service home lab for learning Linux administration, Docker, networking, monitoring, security, local AI, and infrastructure recovery. Instead of dedicating the system to one application, I developed it into a flexible environment where several infrastructure services work together as one connected platform.
The server uses Docker Compose to host services for local DNS, reverse proxying, monitoring, centralized logging, AI experimentation, and system administration. Pi-hole provides local DNS records and filtering, while Nginx Proxy Manager routes the .home.lab addresses to their corresponding services., Grafana and Prometheus provide observability, Loki and Promtail collect logs, Uptime Kuma tracks service availability, and OpenWebUI with Ollama supports local AI testing.
A major part of the project involved more than simply installing applications. I explored how services communicate, how Docker networking affects firewall behavior, how administrative interfaces should be protected, and how the environment could be recovered after a failure. I implemented layered access controls using UFW, Docker’s DOCKER-USER chain, reverse-proxy access lists, restricted management paths, and documented recovery procedures.
This post explains how the server is organized, what each service contributes, how the security model works, and what I learned while building and maintaining a multi-service Linux home lab.
System Overview
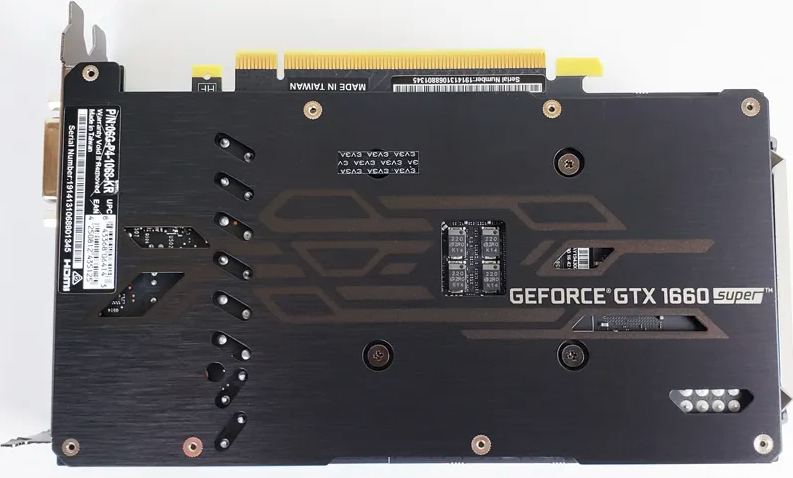
The home lab runs on a repurposed physical desktop configured as an Ubuntu server. The system uses an ASUS H87-PLUS motherboard, an Intel Xeon E3-1231 v3 processor, 24 GB of DDR3 memory, and an NVIDIA GTX 1660 Super. Storage consists of a 512 GB SSD for Ubuntu and active services, along with a 1 TB hard drive used for lab storage and backups.
Although the hardware is older, it provides enough capacity for several Docker services, monitoring tools, local AI testing, hardware validation, and light secondary compute workloads. Repurposing the system also gave me practical experience working within hardware limitations instead of relying on newer enterprise equipment.
The server runs Ubuntu 24.04 LTS and uses Docker Compose to separate its services into dedicated stacks for proxying, DNS, monitoring, logging, and local AI.
How the Services Connect
When a device on the home network opens a service such as grafana.home.lab, Pi-hole first resolves that name to the test server’s local IP address. The request then reaches Nginx Proxy Manager, which forwards it to the correct backend service and applies the relevant access policy.
Behind that entry point, the services communicate across separate Docker networks. Monitoring components collect metrics from the host, containers, GPU, and virtualization layer, while logging components send system and application logs into Grafana for analysis. OpenWebUI connects to Ollama internally, allowing the AI backend to remain unexposed to the wider network.
This design creates a clear separation between the user-facing entry points and the backend services. Users interact with readable local addresses, while the individual applications remain organized by function and protected behind the proxy and firewall layers.
Client Device
|
v
Pi-hole DNS
|
v
Nginx Proxy Manager
|
+—- Grafana
+—- Uptime Kuma
+—- Prometheus
+—- OpenWebUI
+—- Pi-hole Admin
Internal service flows:
Prometheus -> Grafana
Promtail -> Loki -> Grafana
OpenWebUI -> Ollama
Local DNS with Pi-hole
I configured Pi-hole as the DNS server for devices on my home network. By pointing a computer, phone, or other device to the test server for DNS, that device can use Pi-hole’s filtering rules without requiring separate blocking software.
Pi-hole compares DNS requests against maintained blocklists and can prevent known advertising, tracking, telemetry, and other unwanted domains from resolving. Because the filtering happens at the DNS level, it can apply across multiple devices and applications rather than being limited to a single browser.
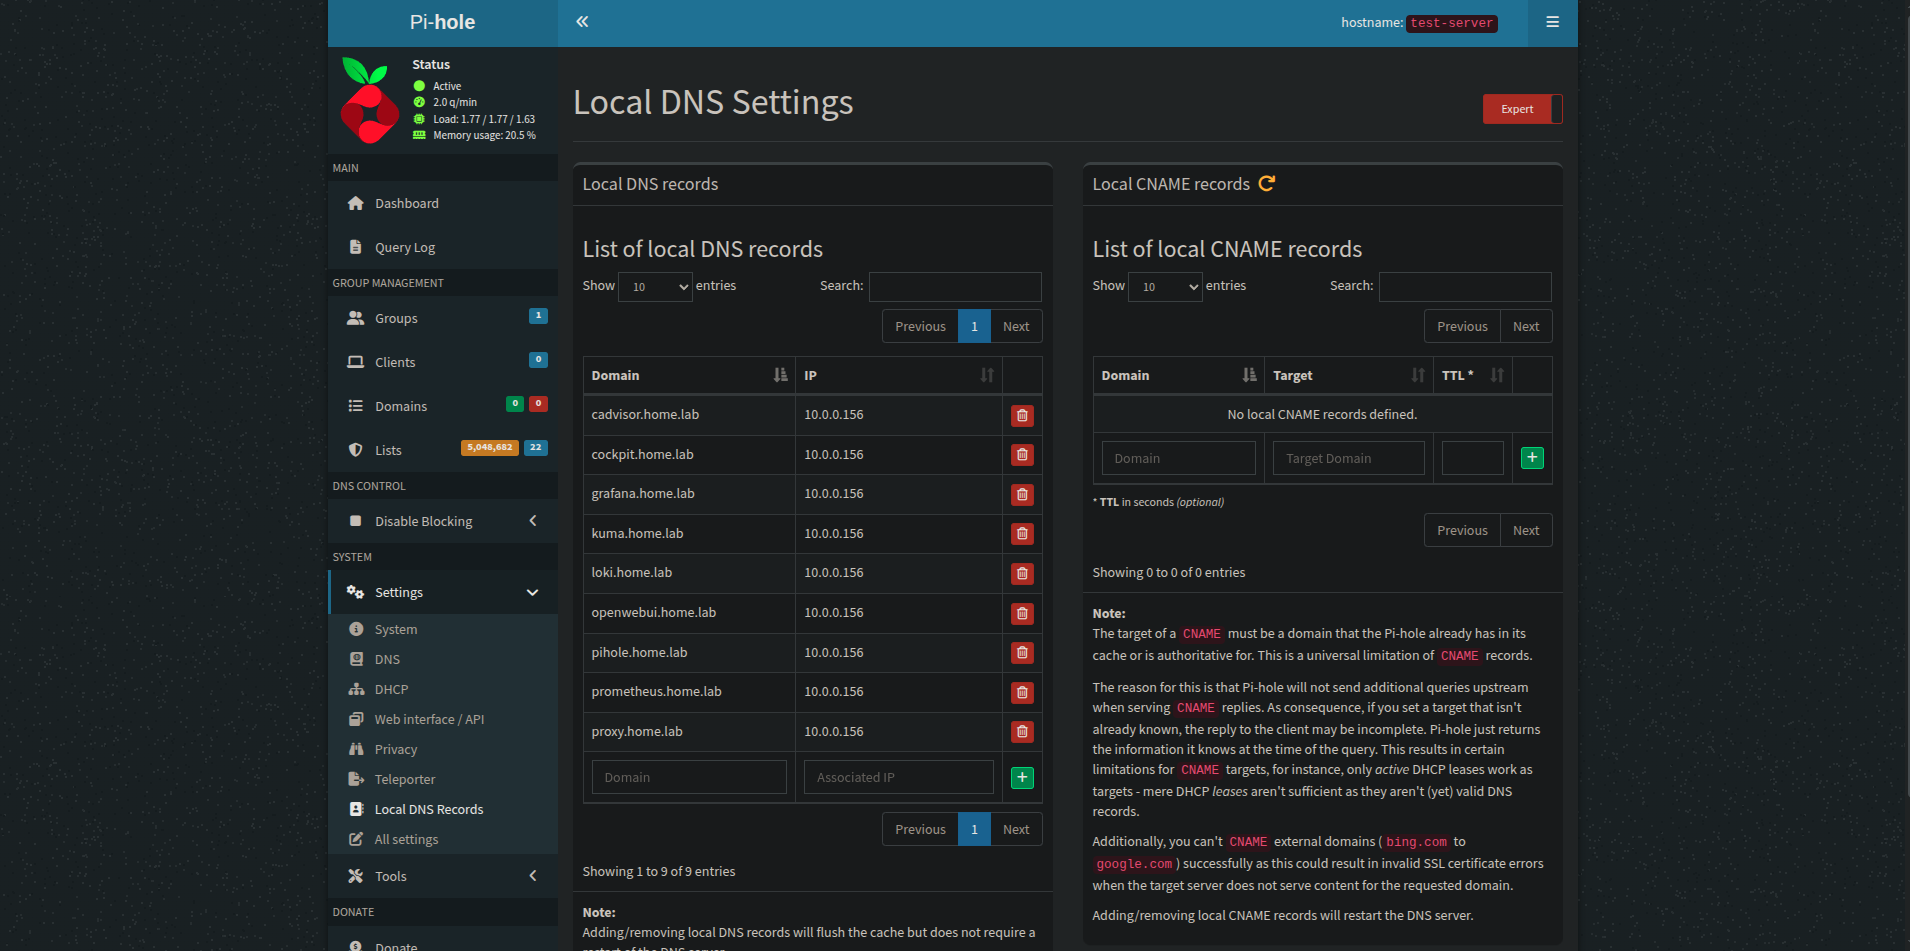
I also use Pi-hole to create local .home.lab records for the services hosted on the server. This gives the environment readable internal names while Pi-hole simultaneously acts as a network utility for DNS filtering and visibility into request activity.
The dashboard and query logs make it possible to review which domains are being requested, identify devices generating unusual traffic, and adjust allowlists or blocklists when a legitimate service is blocked.
Reverse Proxying and Access Control with Nginx Proxy Manager
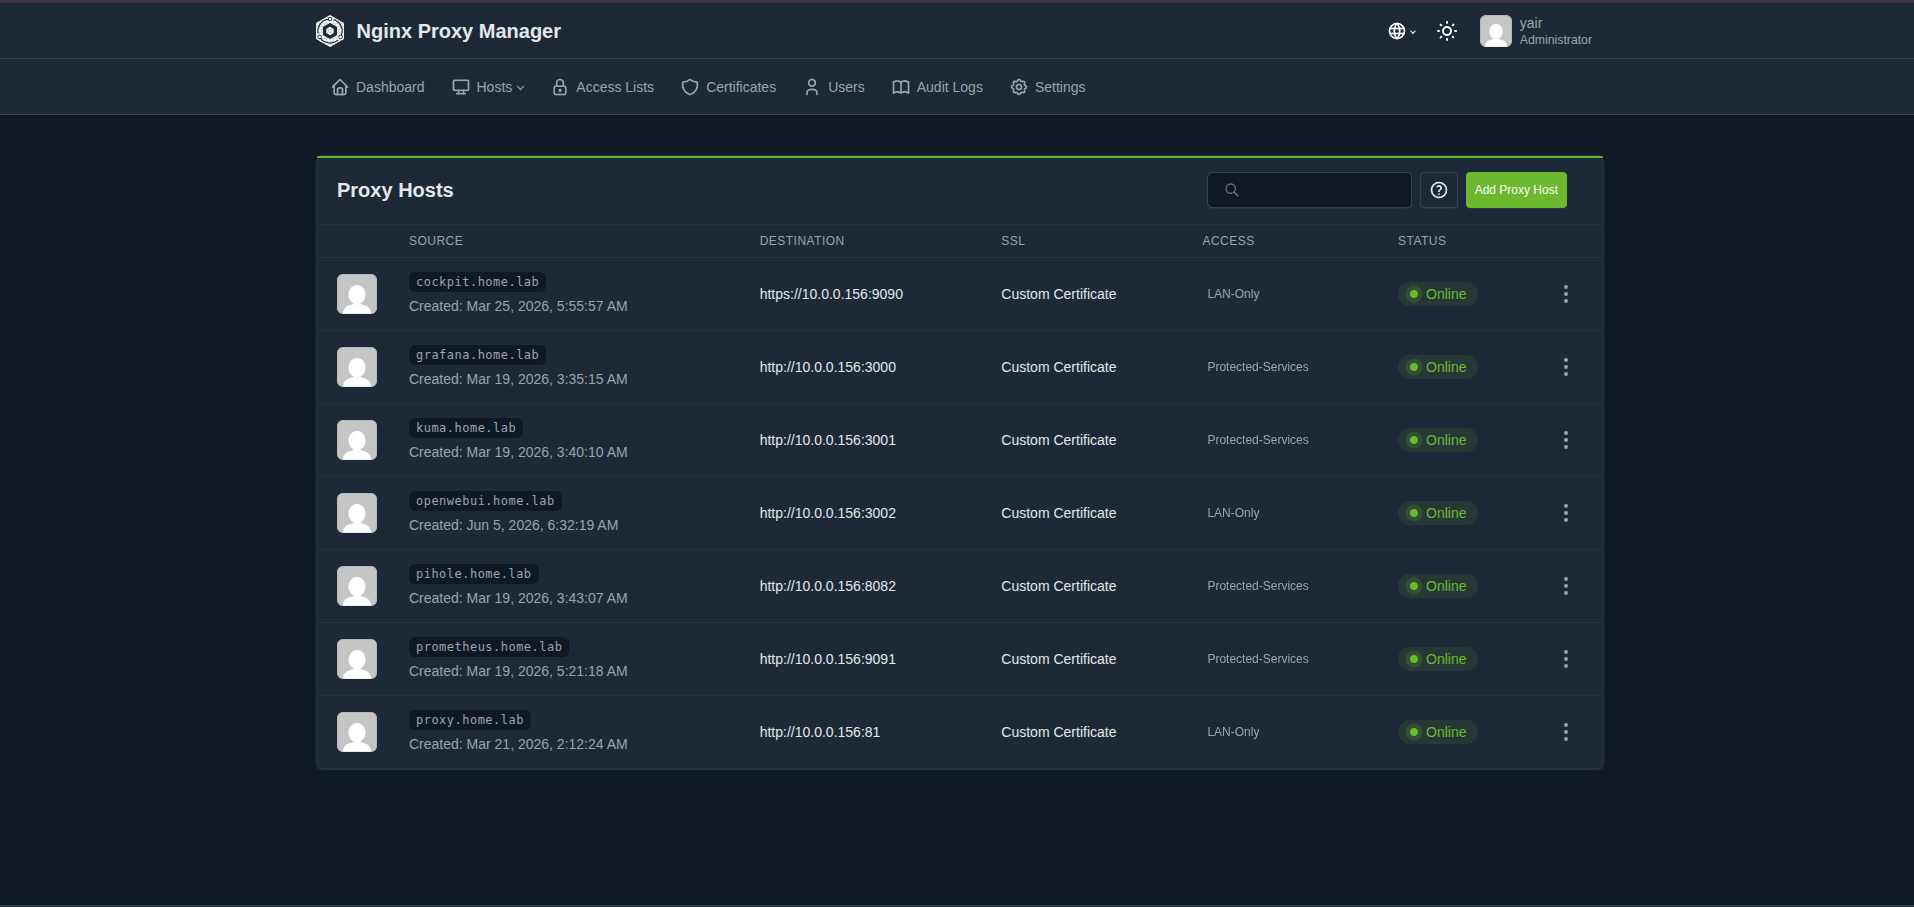
Nginx Proxy Manager acts as the main web entry point for the services hosted on the server. Instead of opening applications through separate port numbers, I created proxy hosts that forward each .home.lab address to the correct backend service.
The proxy also adds a security and management layer. Monitoring and administrative interfaces such as Grafana, Prometheus, Pi-hole, and Uptime Kuma use protected access lists with additional authentication. Other services, including OpenWebUI and Cockpit, use a LAN-only policy where extra proxy authentication could interfere with their own login, websocket, or session behavior.
This approach lets me manage routing, certificates, and access policies from one interface while keeping most backend ports from being general entry points for the rest of the network.
Monitoring System, Containers, GPU, Virtualization, and Service Availability
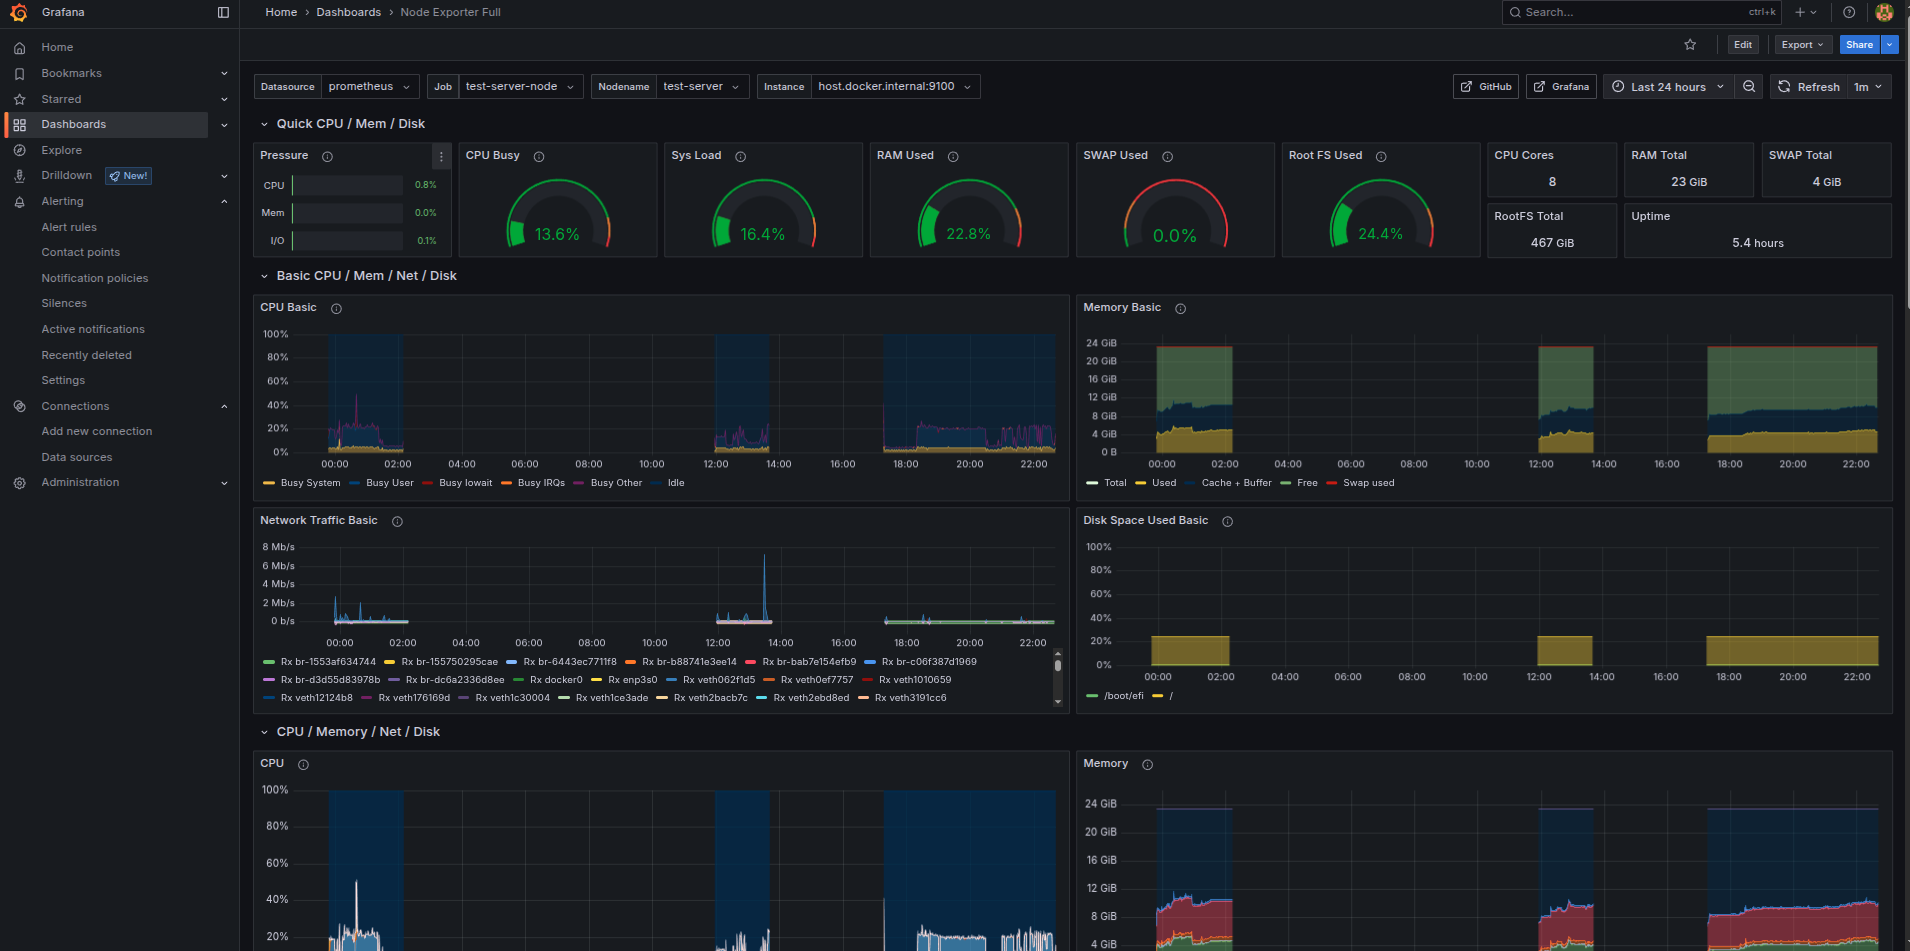
I configured the monitoring environment to provide visibility at several levels rather than relying on a single health indicator. Prometheus collects metrics from the Ubuntu host, Docker containers, the NVIDIA GPU, and the virtualization layer, while Grafana presents that data through separate dashboards.
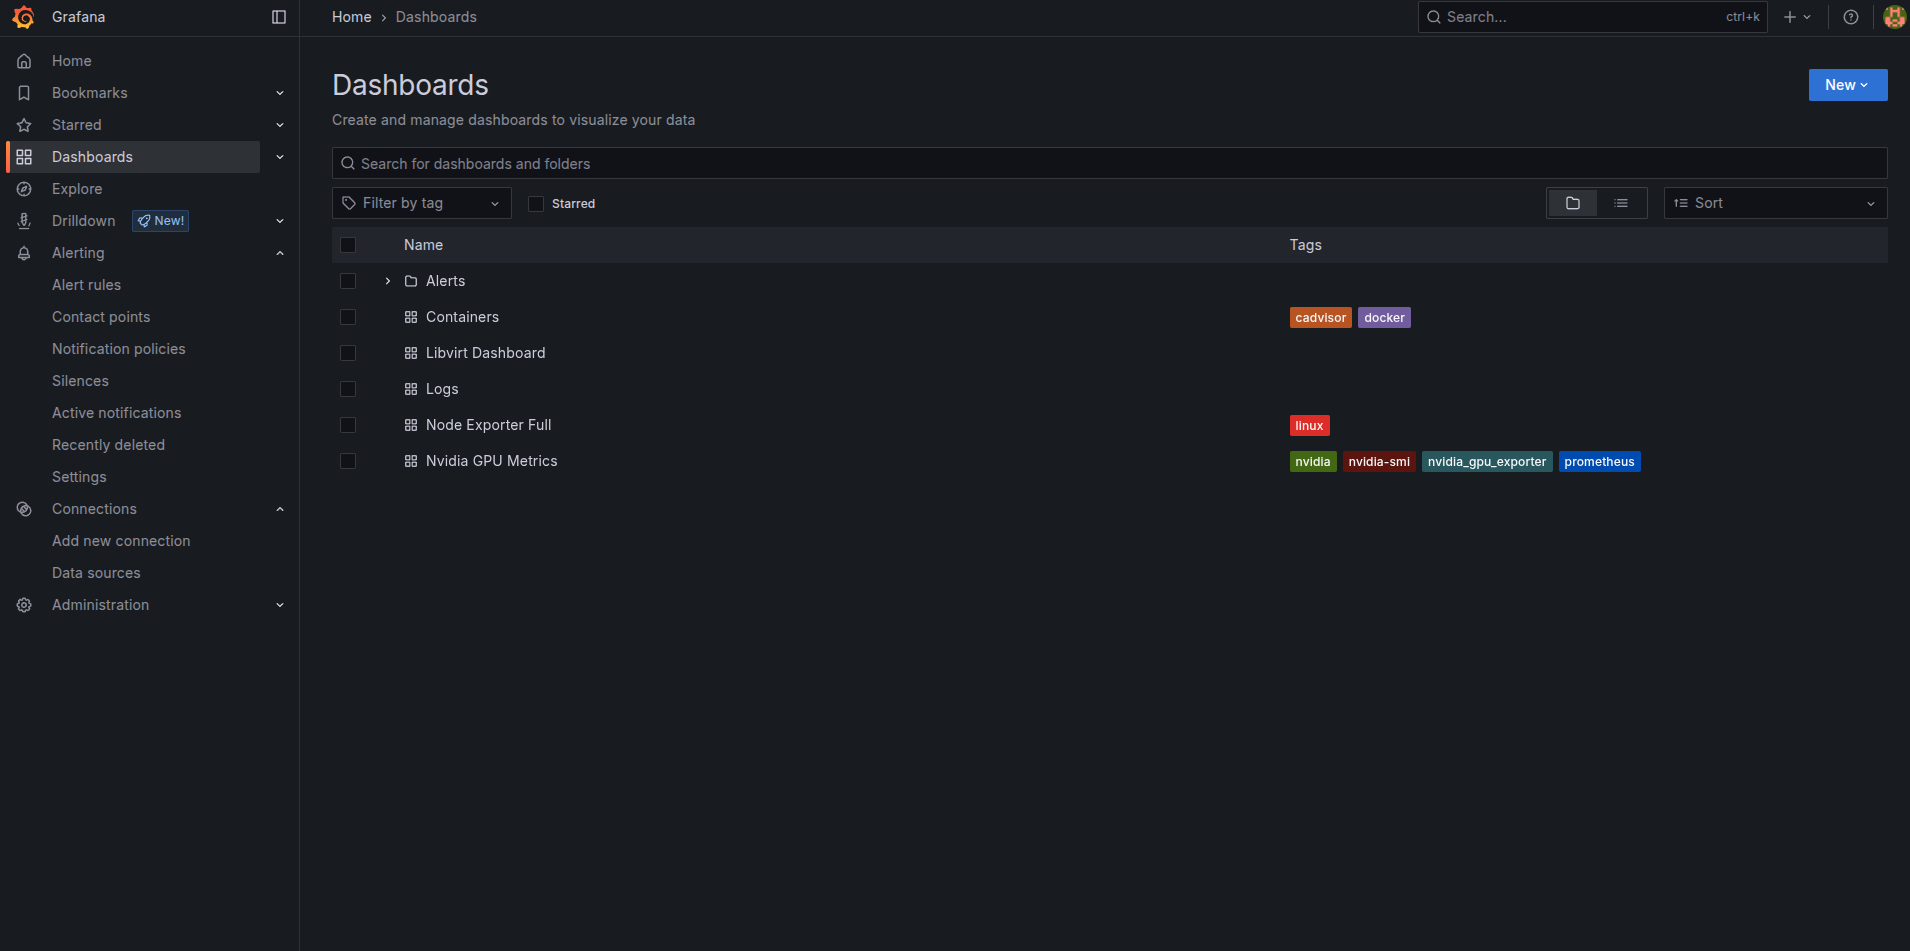
The Node Exporter dashboard shows host-level information such as CPU load, memory usage, disk utilization, network traffic, uptime, and system pressure. The container dashboard, powered by cAdvisor metrics, shows how individual Docker services use CPU, memory, cache, and network resources. This makes it easier to determine whether a performance issue affects the whole server or is isolated to a particular container.
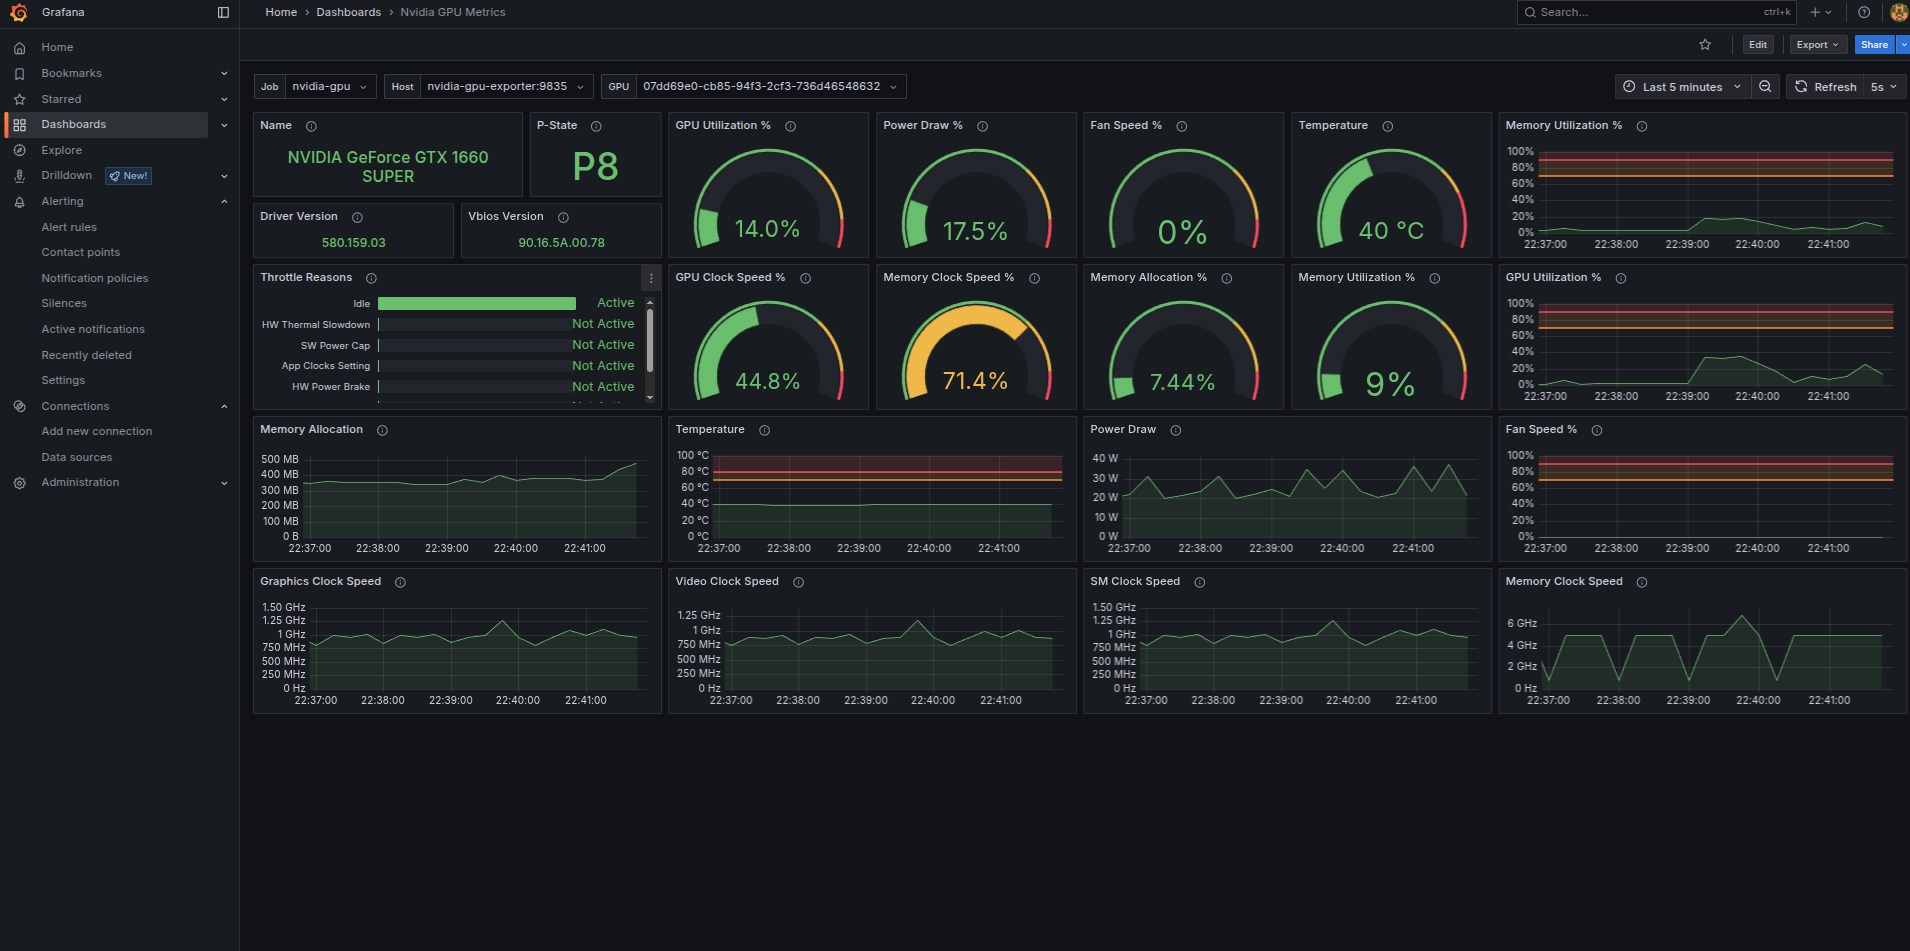
I also created a dedicated NVIDIA GPU dashboard that tracks utilization, temperature, memory allocation, clock speeds, fan activity, and power draw for the GTX 1660 Super. This is useful when testing GPU-enabled applications or local AI workloads. A separate libvirt dashboard provides visibility into the virtualization layer, allowing virtual machine activity to be monitored alongside the rest of the server.
Grafana also includes a logs dashboard, where data collected by Promtail and stored in Loki can be reviewed. This adds context to the metric dashboards by making it possible to compare performance changes with application or system events.
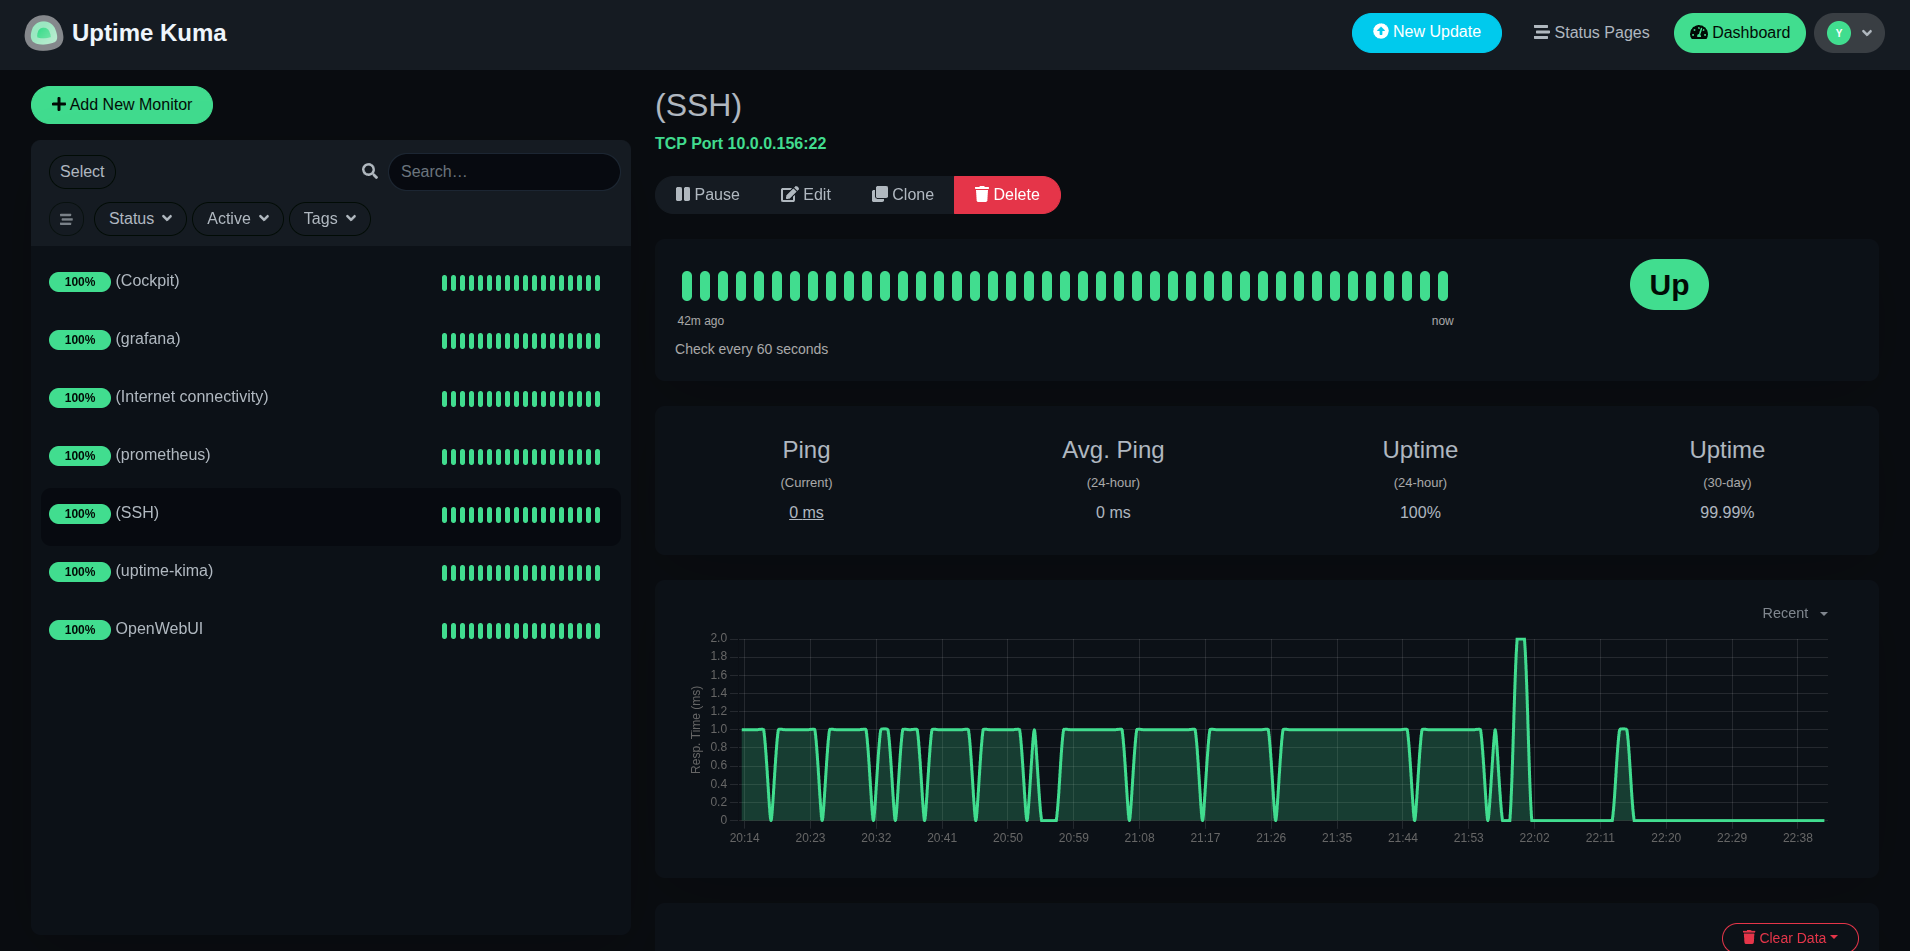
Uptime Kuma performs a different role by actively checking whether important services and management paths are reachable. It monitors utilities such as Grafana, Prometheus, Cockpit, OpenWebUI, SSH, Uptime Kuma itself, and internet connectivity, providing a quick operational view alongside the more detailed Grafana dashboards.
Centralized Logging with Loki and Promtail
Metrics show what changed, but logs help explain why it changed. To add that second layer of visibility, I configured Promtail to collect logs and send them to Loki, where they can be searched and reviewed through Grafana.
This gives me one place to investigate application messages, warnings, errors, and other events without checking each container separately. When a service becomes slow or unavailable, I can compare its logs with the same time period shown in the monitoring dashboards and look for configuration problems, failed connections, restarts, or other causes.
Keeping Loki and Promtail internal to the Docker environment also avoids exposing the logging backend directly to the network. Grafana acts as the main interface for exploring the stored log data.
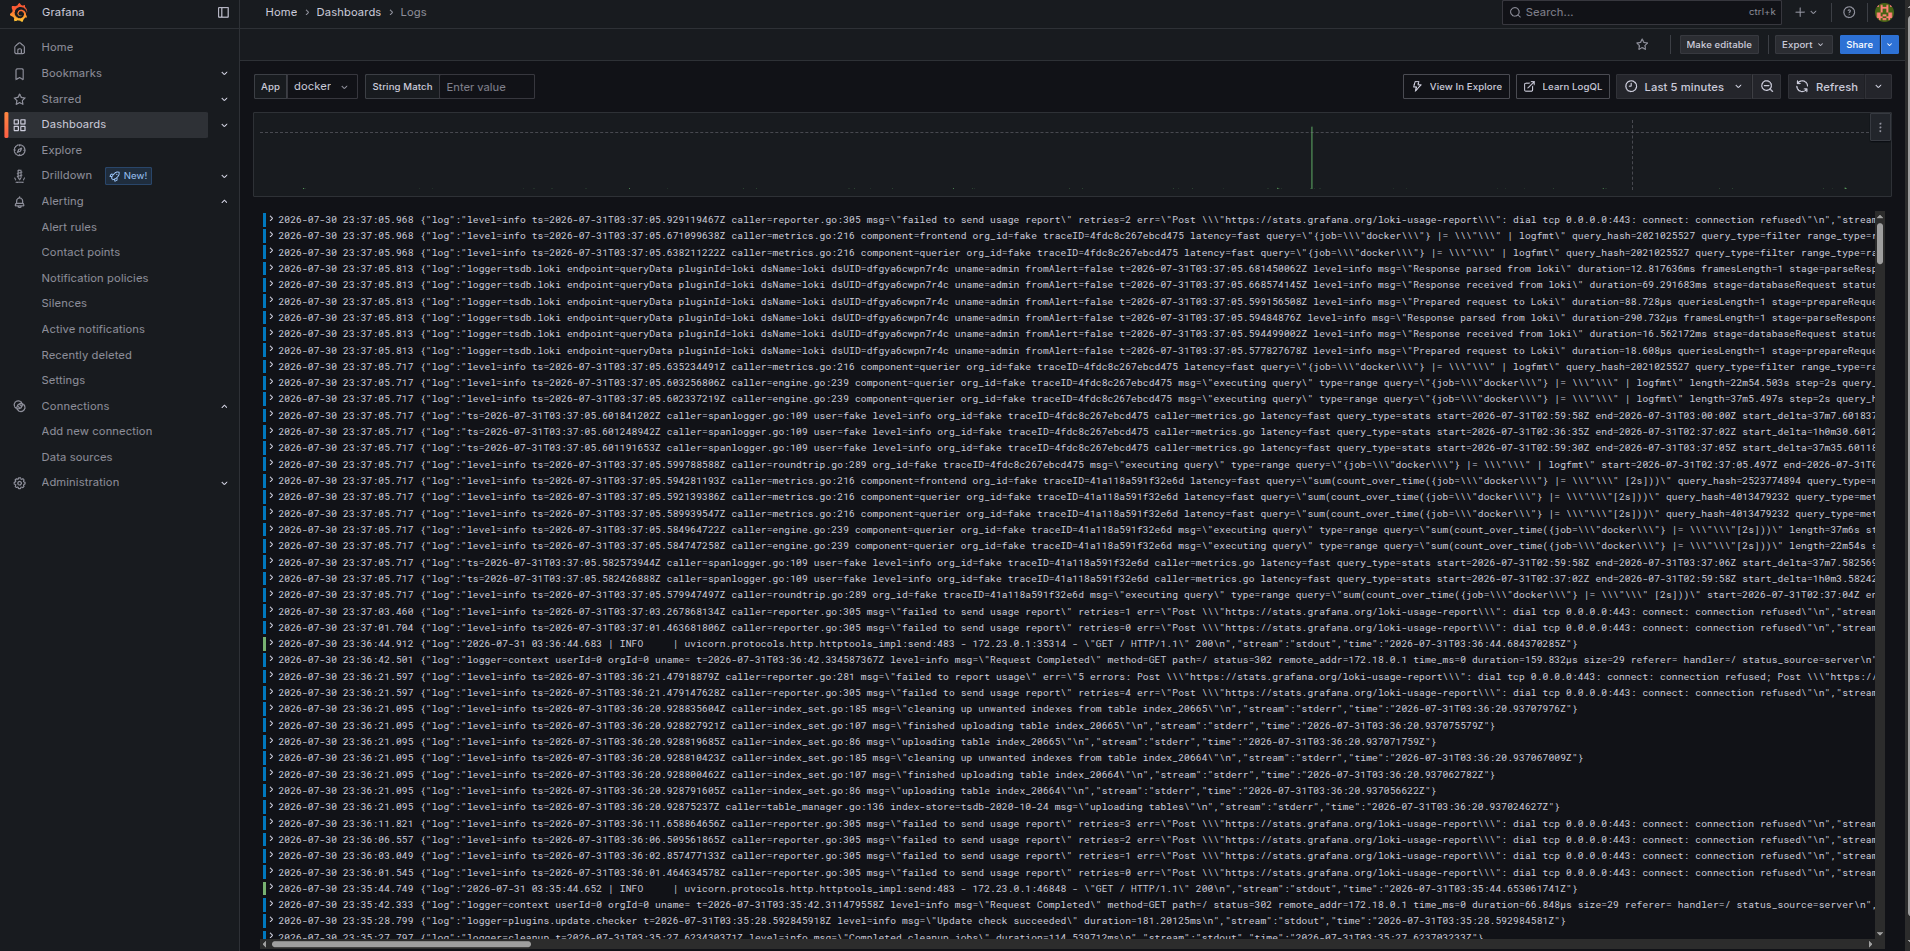
Centralized log analysis in Grafana: Promtail collects logs from the environment and forwards them to Loki, allowing service events to be searched alongside performance metrics.
Local AI with OpenWebUI and Ollama
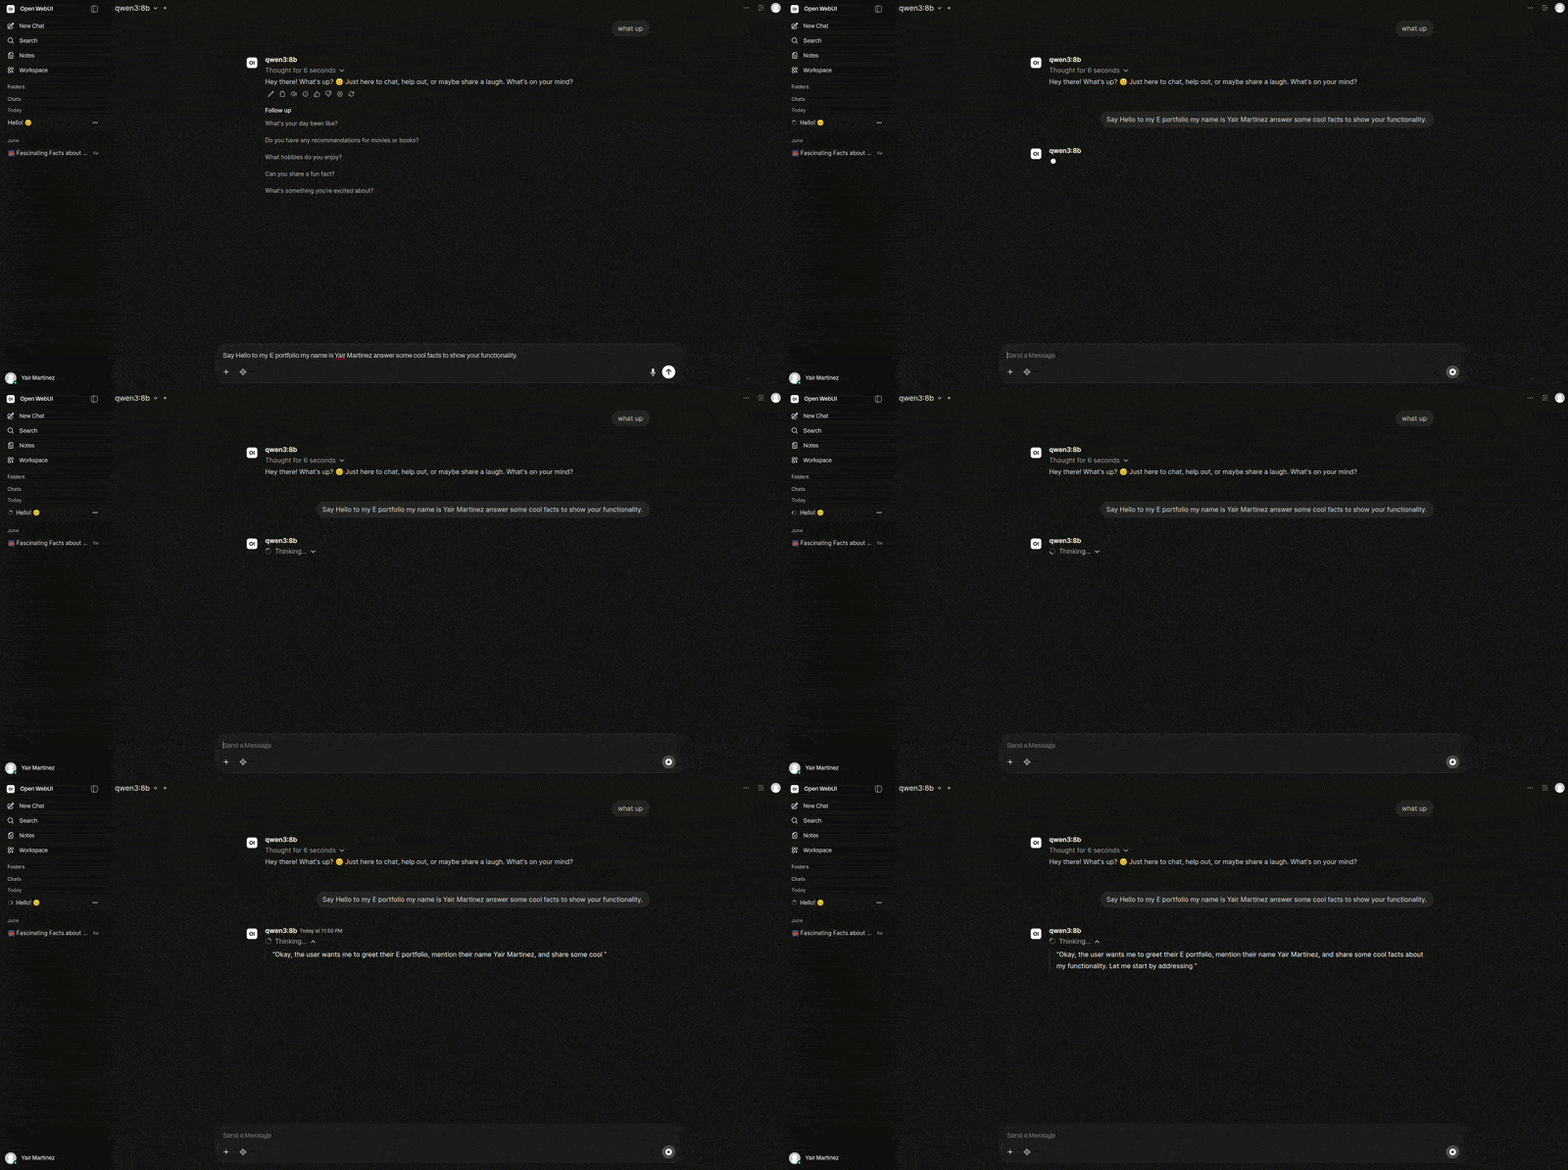
I added a local AI stack so the server could run language models without depending entirely on an external cloud service. OpenWebUI provides the browser-based interface, while Ollama runs the models in the background and handles the local inference workload.
OpenWebUI is the part I interact with directly. It provides a familiar chat interface, model selection, conversation history, and a central place to test different local models. Ollama remains on the backend and is only bound to the server’s localhost interface, which keeps it from being exposed directly to the wider network.
The GTX 1660 Super can assist with smaller models and lightweight experimentation, although its limited VRAM places practical limits on model size and speed. Even with those constraints, the setup is useful for testing local AI workflows, comparing model behavior, and observing how CPU, memory, and GPU usage change during inference.
Because the AI stack is tied into the monitoring environment, I can also watch GPU temperature, utilization, memory allocation, clock speed, and power draw while a model is running. This connects the AI workload to the broader hardware and observability goals of the project.
Layered Network Security
Running multiple services on one server created a security challenge: several Docker applications publish their own backend ports, but those ports should not automatically become available to every device on the network.
I addressed this with a layered access model. UFW protects host-level services and limits administrative ports such as SSH, Cockpit, Grafana, Prometheus, and the Nginx Proxy Manager admin interface to my trusted workstation. General LAN devices are allowed to reach only the services they need, such as Pi-hole DNS and the reverse-proxy frontend.
I also configured Docker’s DOCKER-USER firewall chain. This is important because Docker can manage its own forwarding rules, meaning published container ports do not always behave the way someone might expect from UFW alone. The DOCKER-USER rules allow established connections, trusted sources, Docker’s internal networks, and the reverse-proxy ports, while dropping untrusted direct access to selected backend ports.
Nginx Proxy Manager adds another layer through its access lists. Some interfaces use a Protected-Services policy with additional authentication, while applications that rely on their own sessions or websocket behavior use a restricted LAN-Only policy instead.
This creates three complementary controls:
- UFW protects the Ubuntu host.
- DOCKER-USER controls direct access to published container ports.
- Nginx Proxy Manager controls web access at the application entry point.
The result is that users can reach approved services through normal .home.lab addresses, while backend and administrative interfaces remain limited to trusted paths.
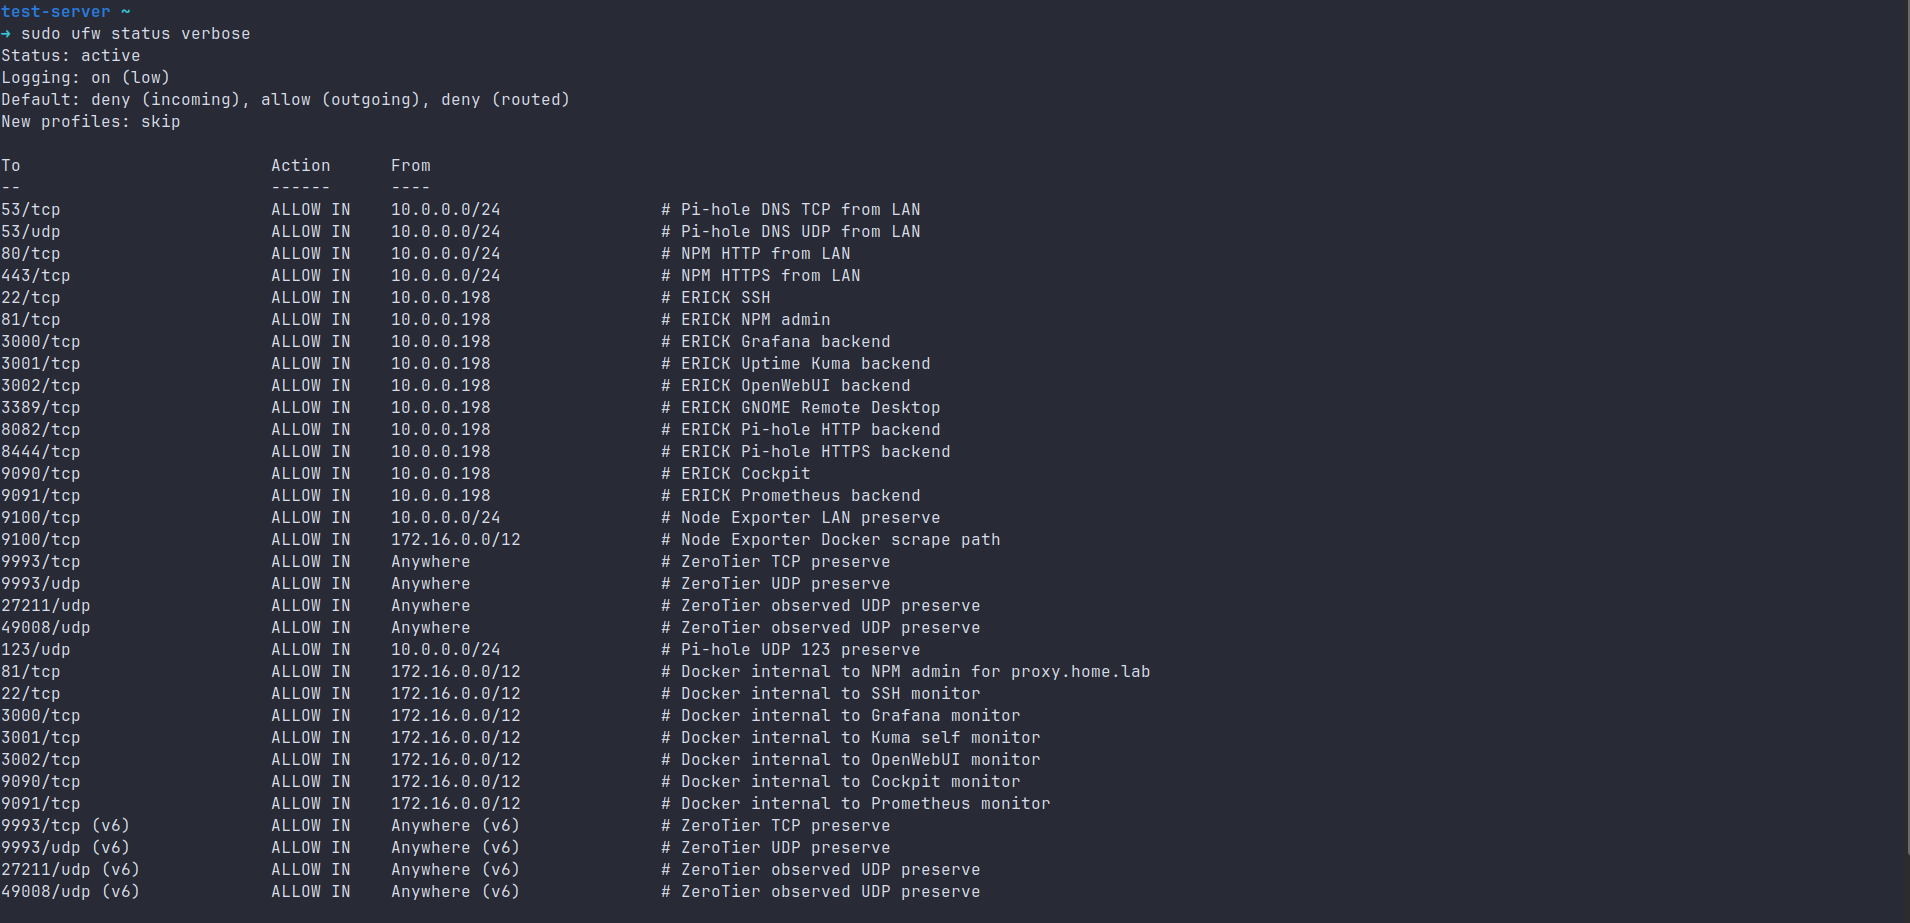
UFW host firewall: General LAN access is limited to DNS and reverse-proxy traffic, while administrative services are restricted to the trusted workstation.
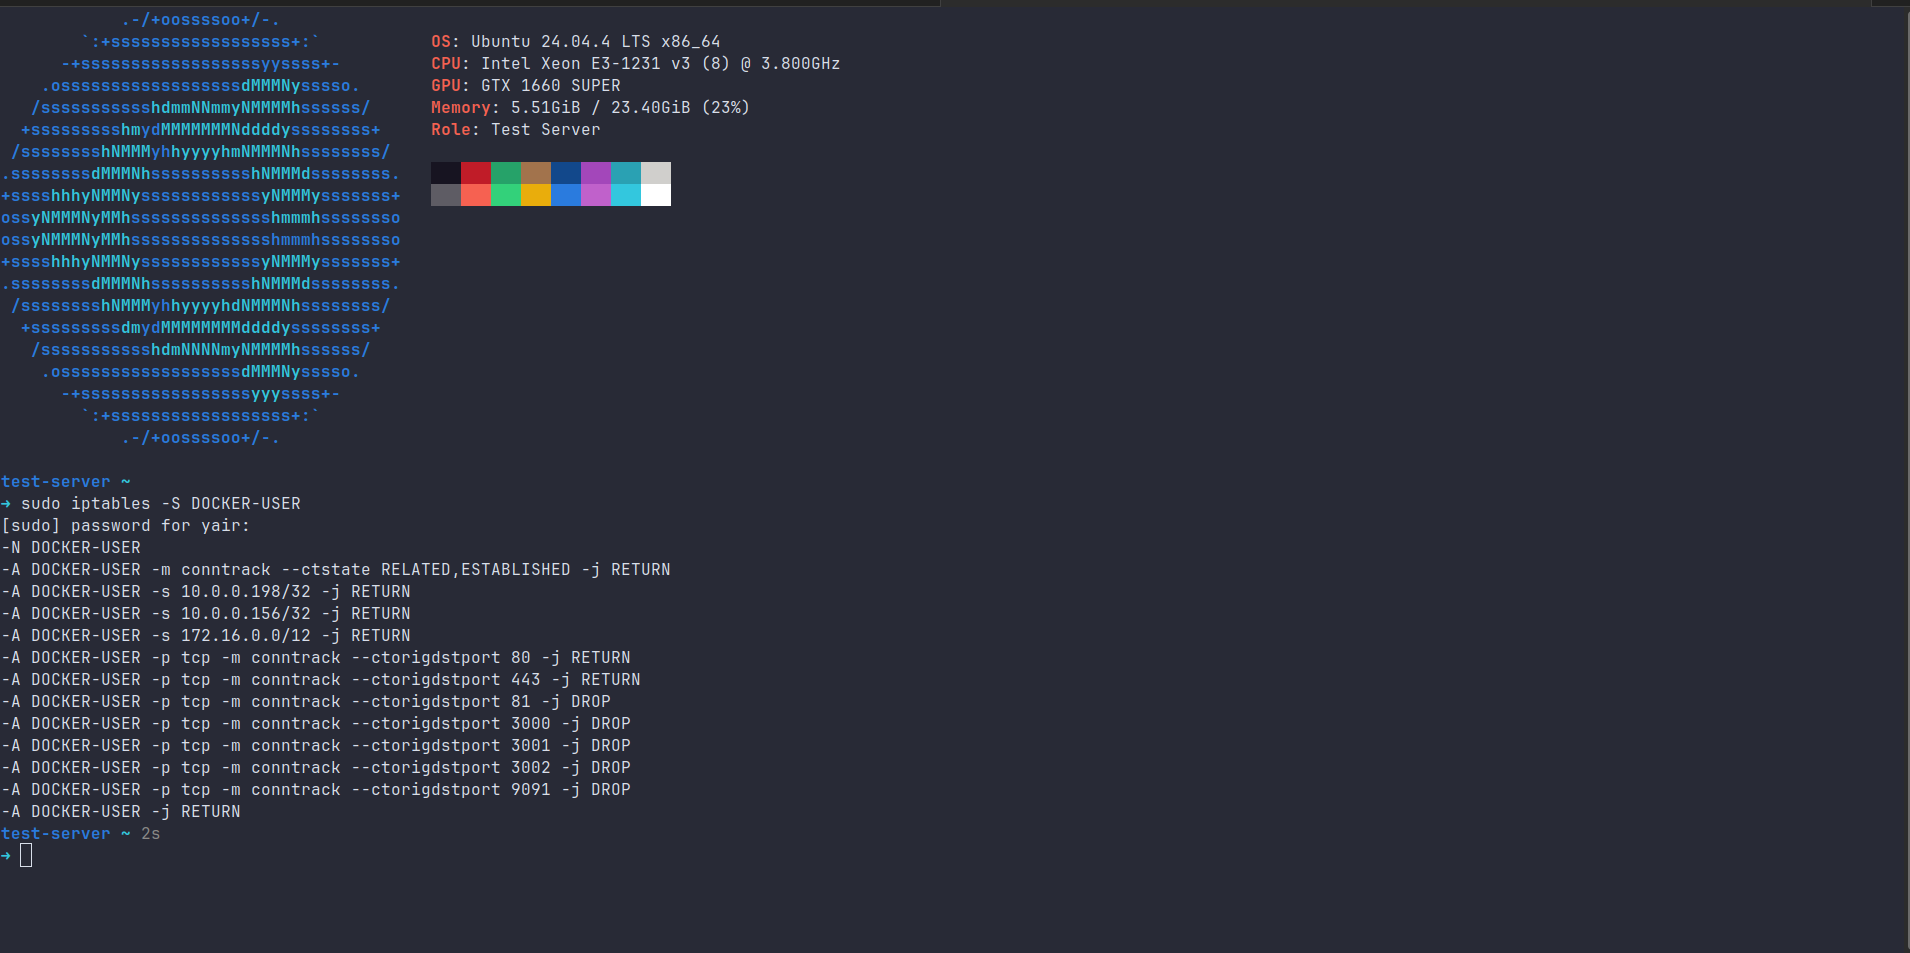
Docker firewall control: The DOCKER-USER chain permits trusted traffic and blocks unapproved direct access to published backend ports.
Remote Administration with Cockpit and SSH
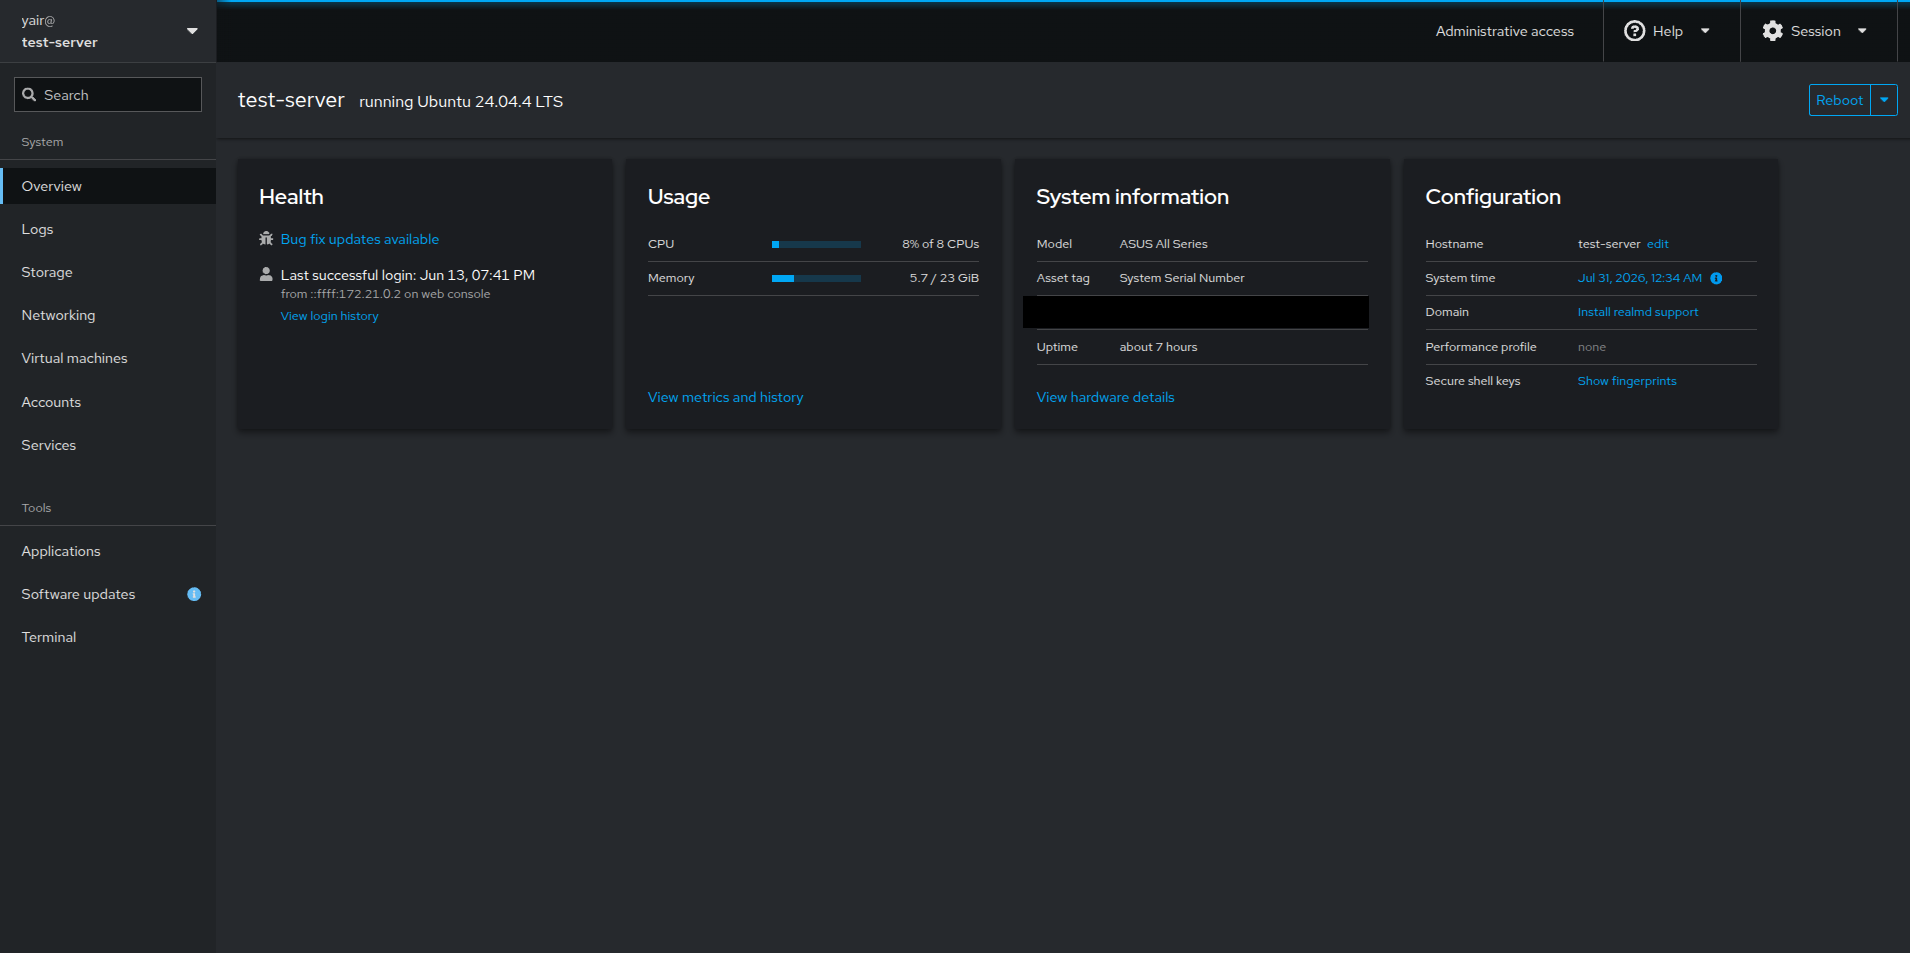
To manage the Ubuntu host itself, I use both Cockpit and SSH. Cockpit provides a browser-based interface for checking system performance, storage, services, logs, networking, and updates, while SSH gives me direct command-line access for configuration and troubleshooting.
I kept direct Cockpit access available from my trusted workstation rather than depending entirely on the reverse proxy. During testing, Cockpit’s websocket, TLS, and origin requirements made proxy access less reliable, so the direct connection became an intentional recovery path rather than an unfinished workaround.
Using both tools gives me two complementary administration methods:
- Cockpit for quick visual checks and routine management
- SSH for precise commands, configuration changes, and emergency recovery
This redundancy is important because a failure in Docker, DNS, or Nginx Proxy Manager should not prevent me from accessing and repairing the underlying server.
Backup and Recovery Planning
I designed the server so that important services could be restored without relying on memory alone. Docker Compose files are kept under /srv/compose, persistent service data is stored under /srv/data, and backup material is maintained on the separate LAB-STORAGE drive.
Recovery planning also includes preserving more than one administrative path. SSH is the primary command-line option, Cockpit provides direct browser-based management, and local console access remains available if networking or Docker services fail.
The firewall configuration is also treated as recovery-sensitive. Before changing UFW or the DOCKER-USER chain, I verify that a working management path remains available and capture the current rules so they can be restored if necessary.
This approach turns the server from a collection of working services into an environment that can be documented, troubleshot, and rebuilt after a failure.
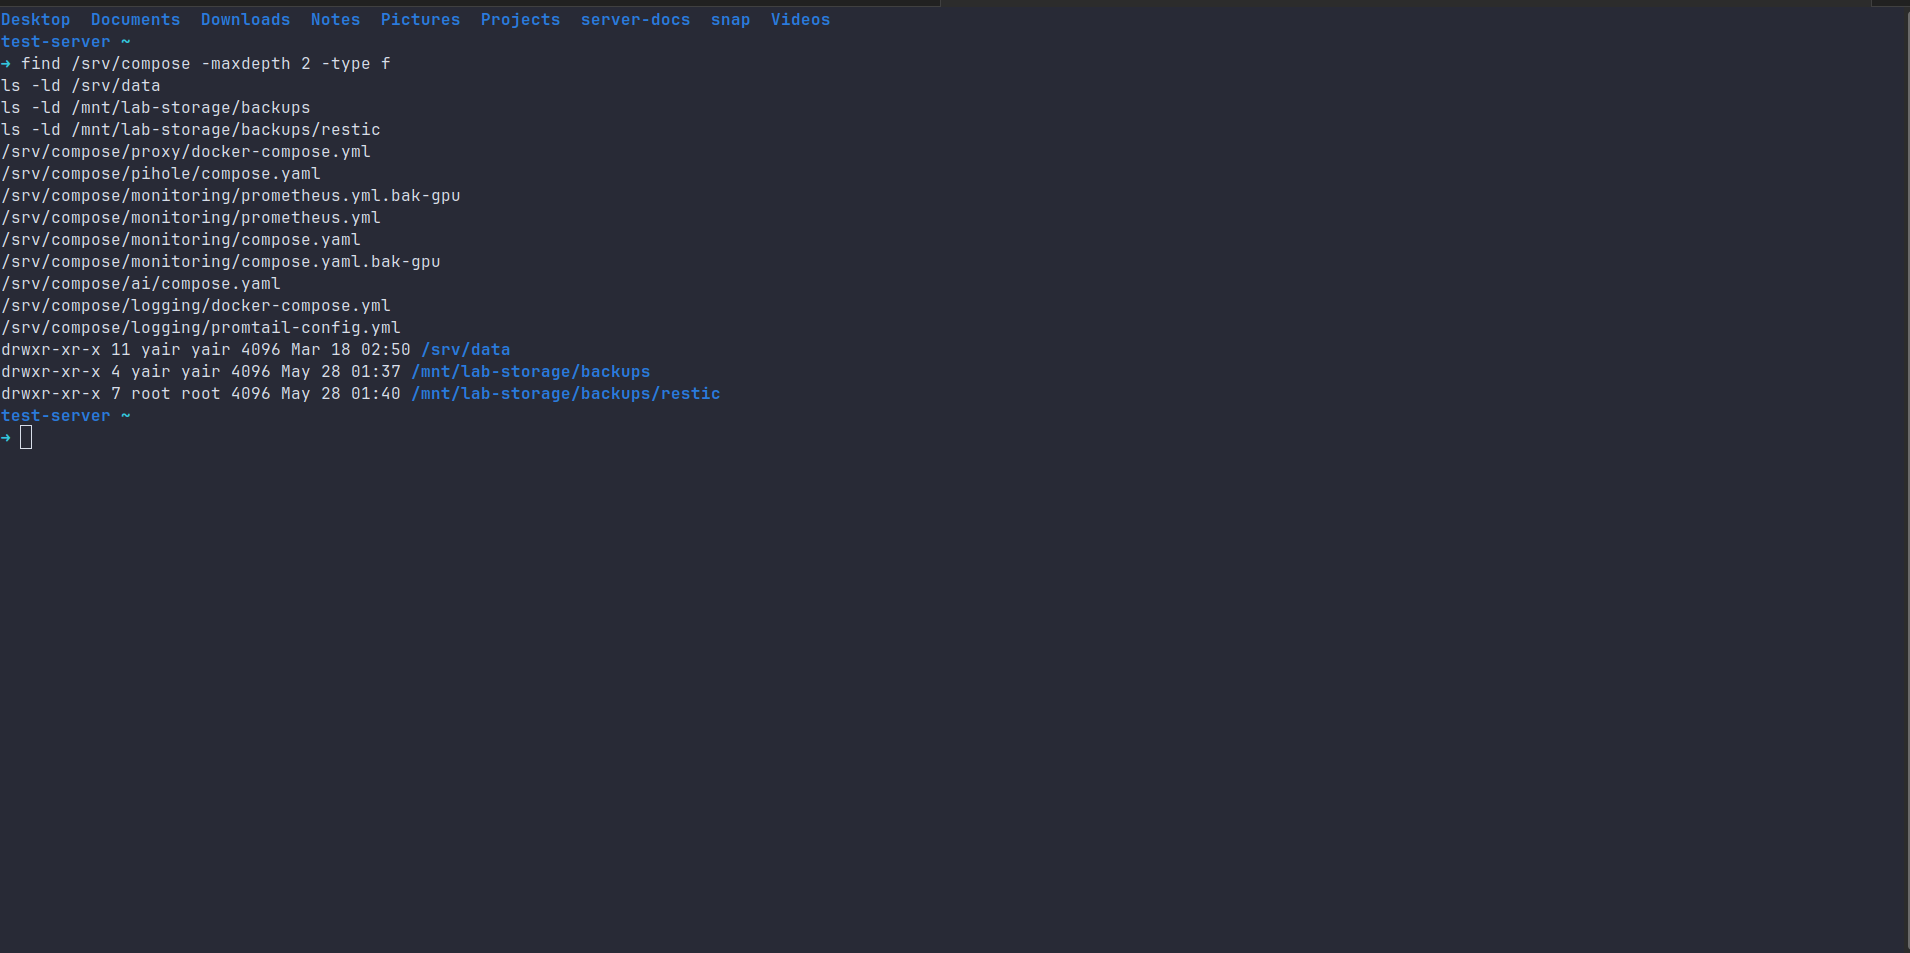
Recovery and backup structure: Docker Compose definitions, persistent service data, and the Restic backup repository are stored in separate, documented locations to support rebuilding and restoration.
Lessons Learned
I wanted to build an all-in-one server, and this project gave me an introduction to the deployment strategies and practical considerations involved in running several services together in a home environment.
As the project grew, I had to add security controls in stages rather than all at once. This helped me understand how access rules, reverse proxying, Docker networking, and administrative paths affect one another.
I also learned that building a stable multi-service system involves compromises. Some services required workarounds, and not every tool could be managed in exactly the same way. I had to consider how the services would work together, where direct access was still necessary, and how one change could affect the rest of the environment.
Another major lesson was the importance of documentation. On a project with many services, paths, rules, and decisions, it is easy to forget why something was configured a certain way. Keeping clear documentation made it much easier to return to the project, understand the current state, and continue working without having to rediscover everything.
Project Outcome
The final result is a working multi-service Ubuntu home lab that brought DNS, reverse proxying, monitoring, logging, local AI, remote administration, firewall controls, backups, and recovery planning together on one physical system.
The server gave me a practical environment where I could deploy services, test changes, troubleshoot problems, and learn how different tools behave when they are connected as part of a larger system. It also helped me understand that an all-in-one setup is useful for learning, but it is not always the most efficient long-term design.
The next stage of the project is to separate the workloads based on their needs. Virtualization and local AI will move to a more powerful machine, while lighter services such as Pi-hole can run on a lower-power system. Backups will also move to a dedicated machine so storage and recovery tasks are separated from experimentation and compute workloads.
This separation will allow each system to be optimized for its specific role. High-performance hardware can be used where CPU, memory, and GPU resources matter, while always-on infrastructure services can run on more energy-efficient hardware. The original test server will remain valuable as the platform where I learned how these services work together before dividing them into a more specialized home lab environment.